Swimming Pool Data VisualizatioN
infographic
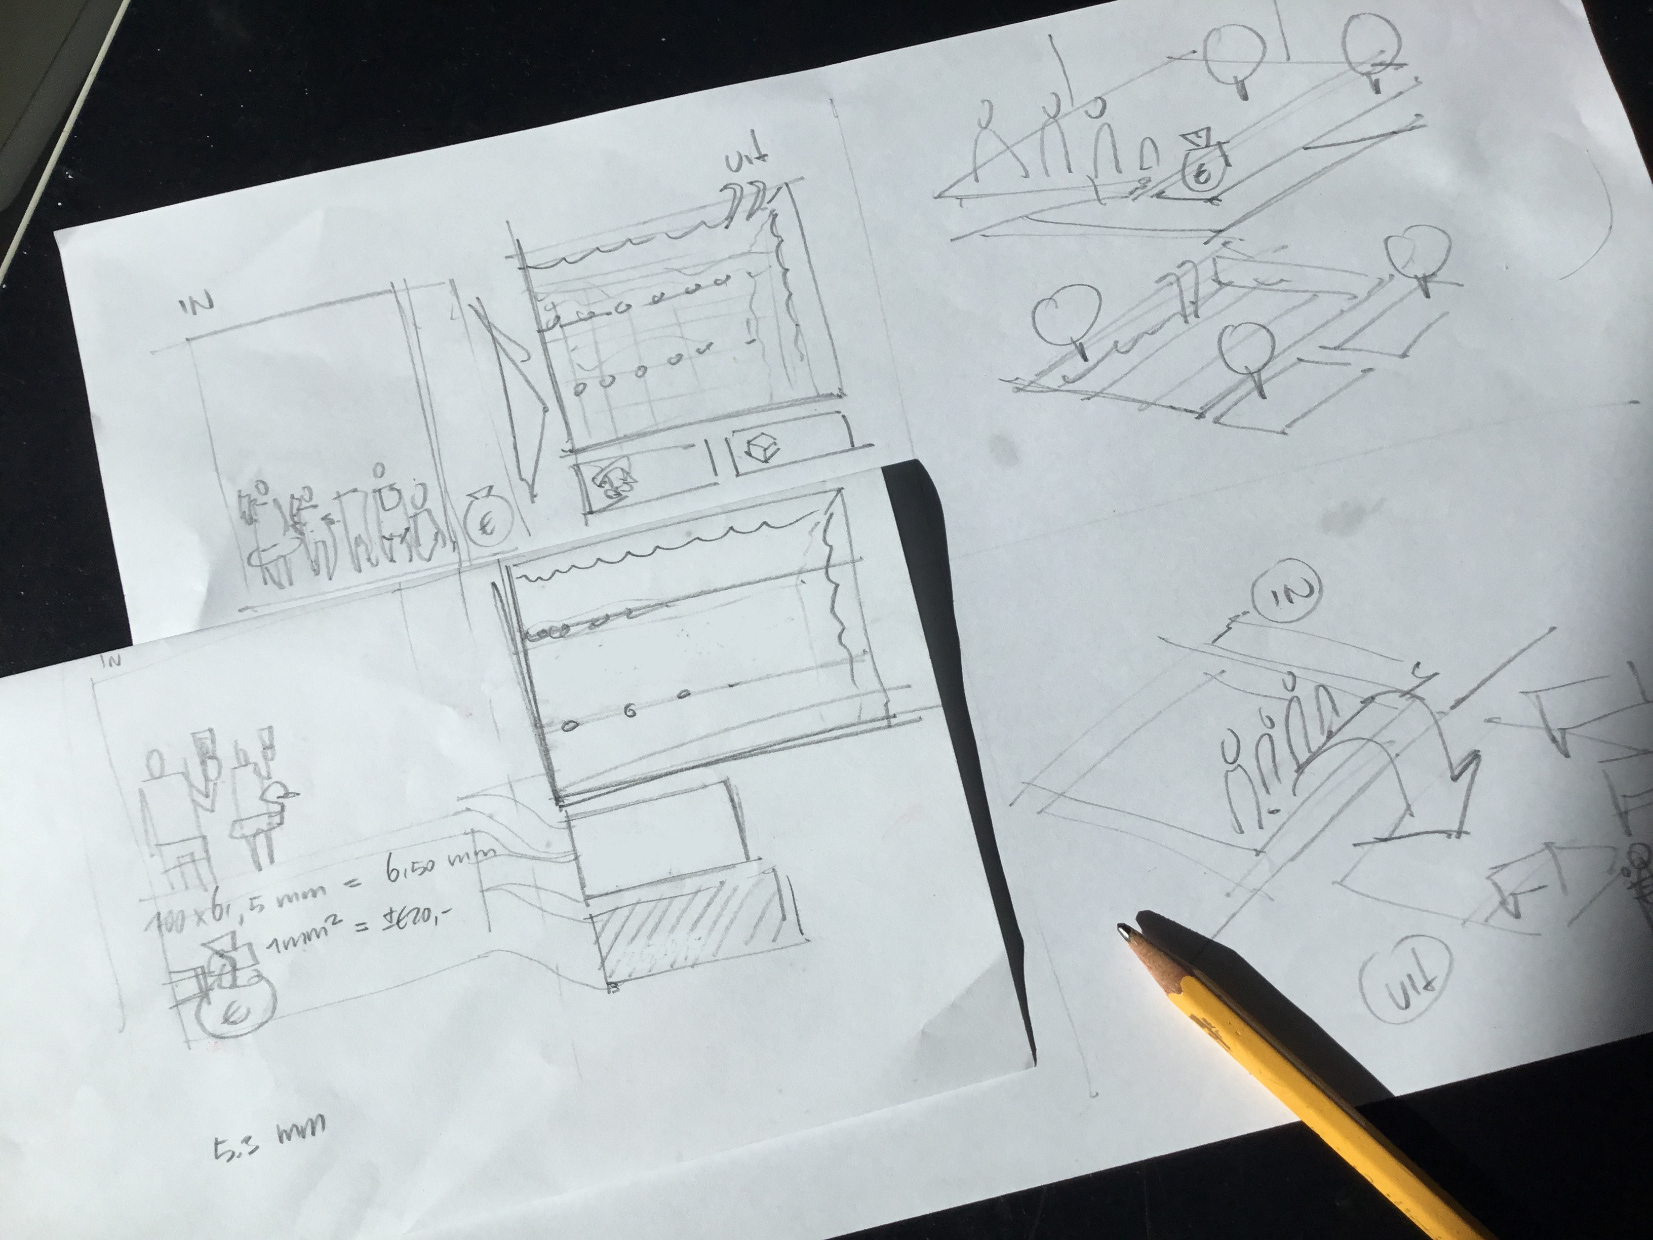
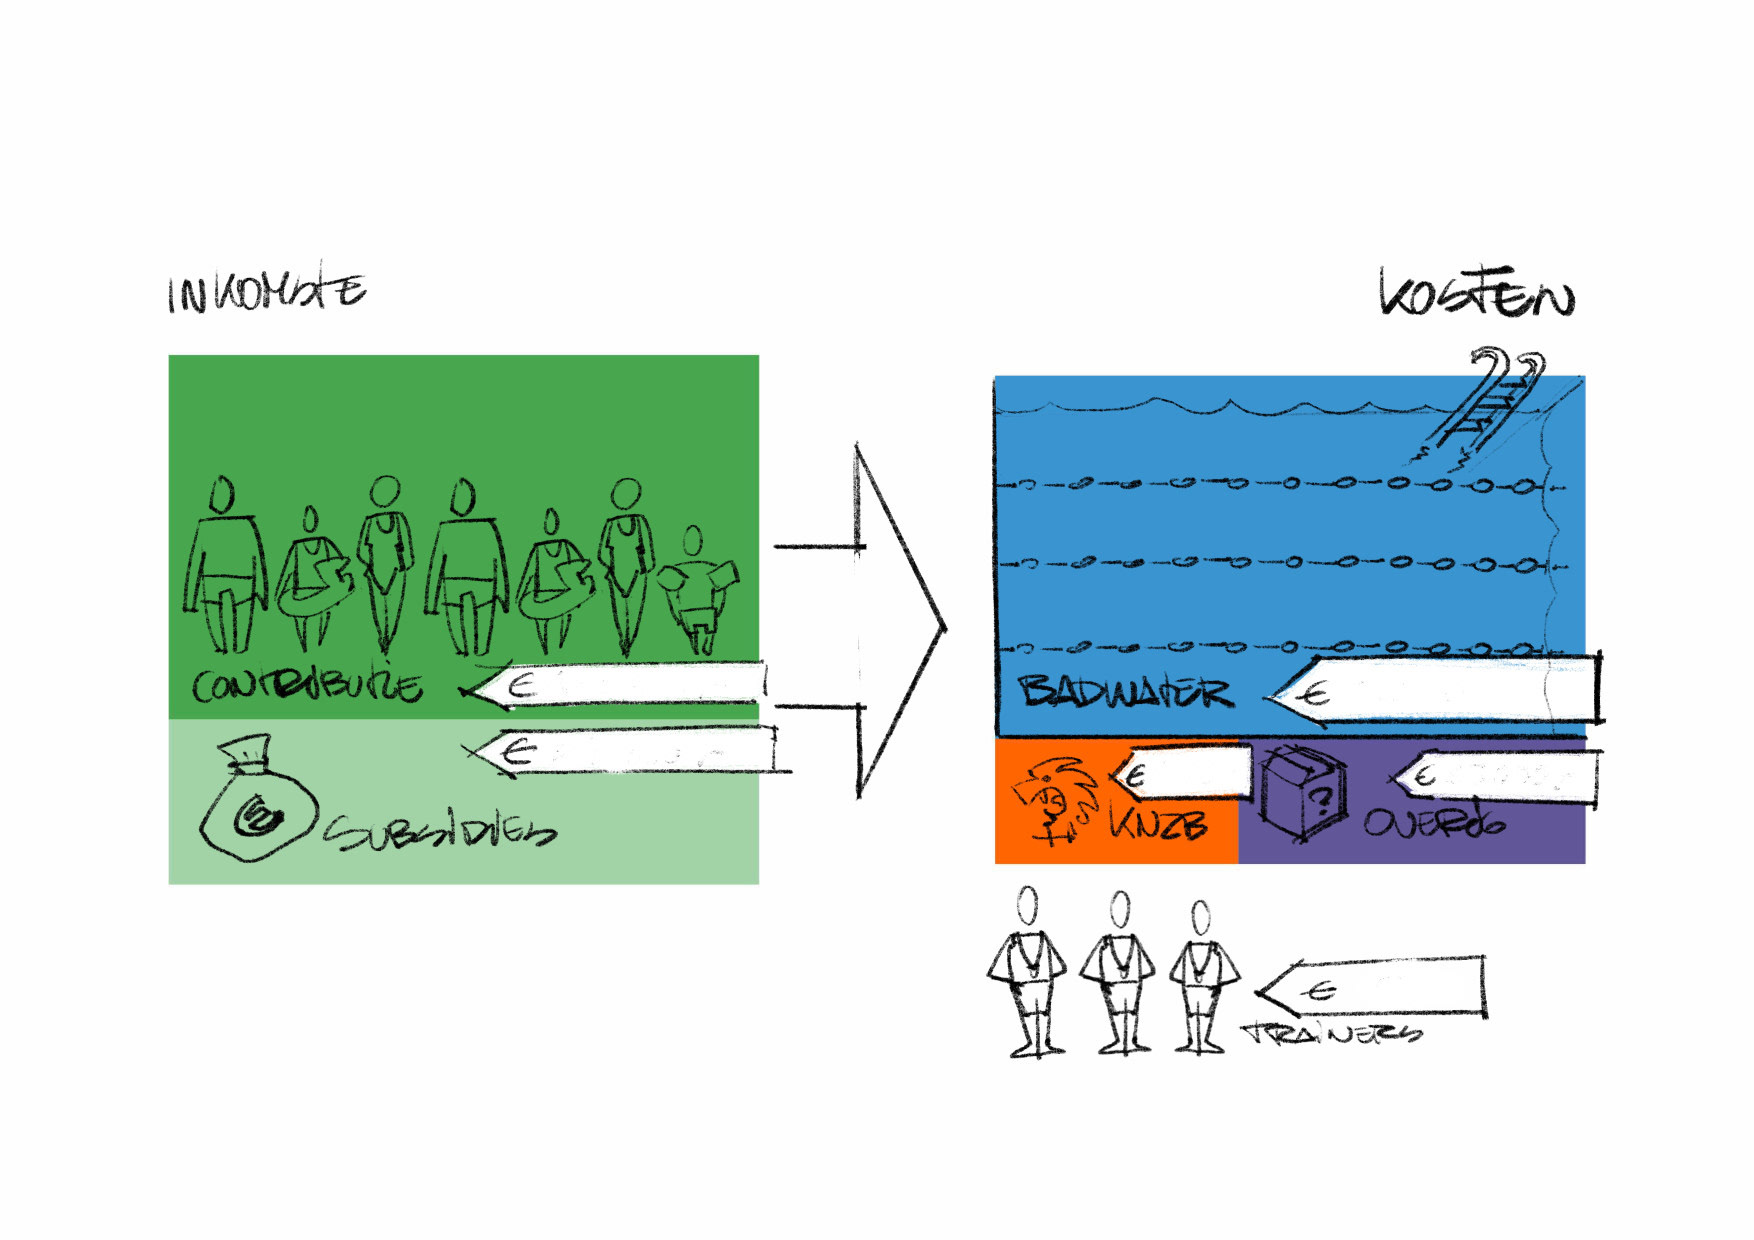
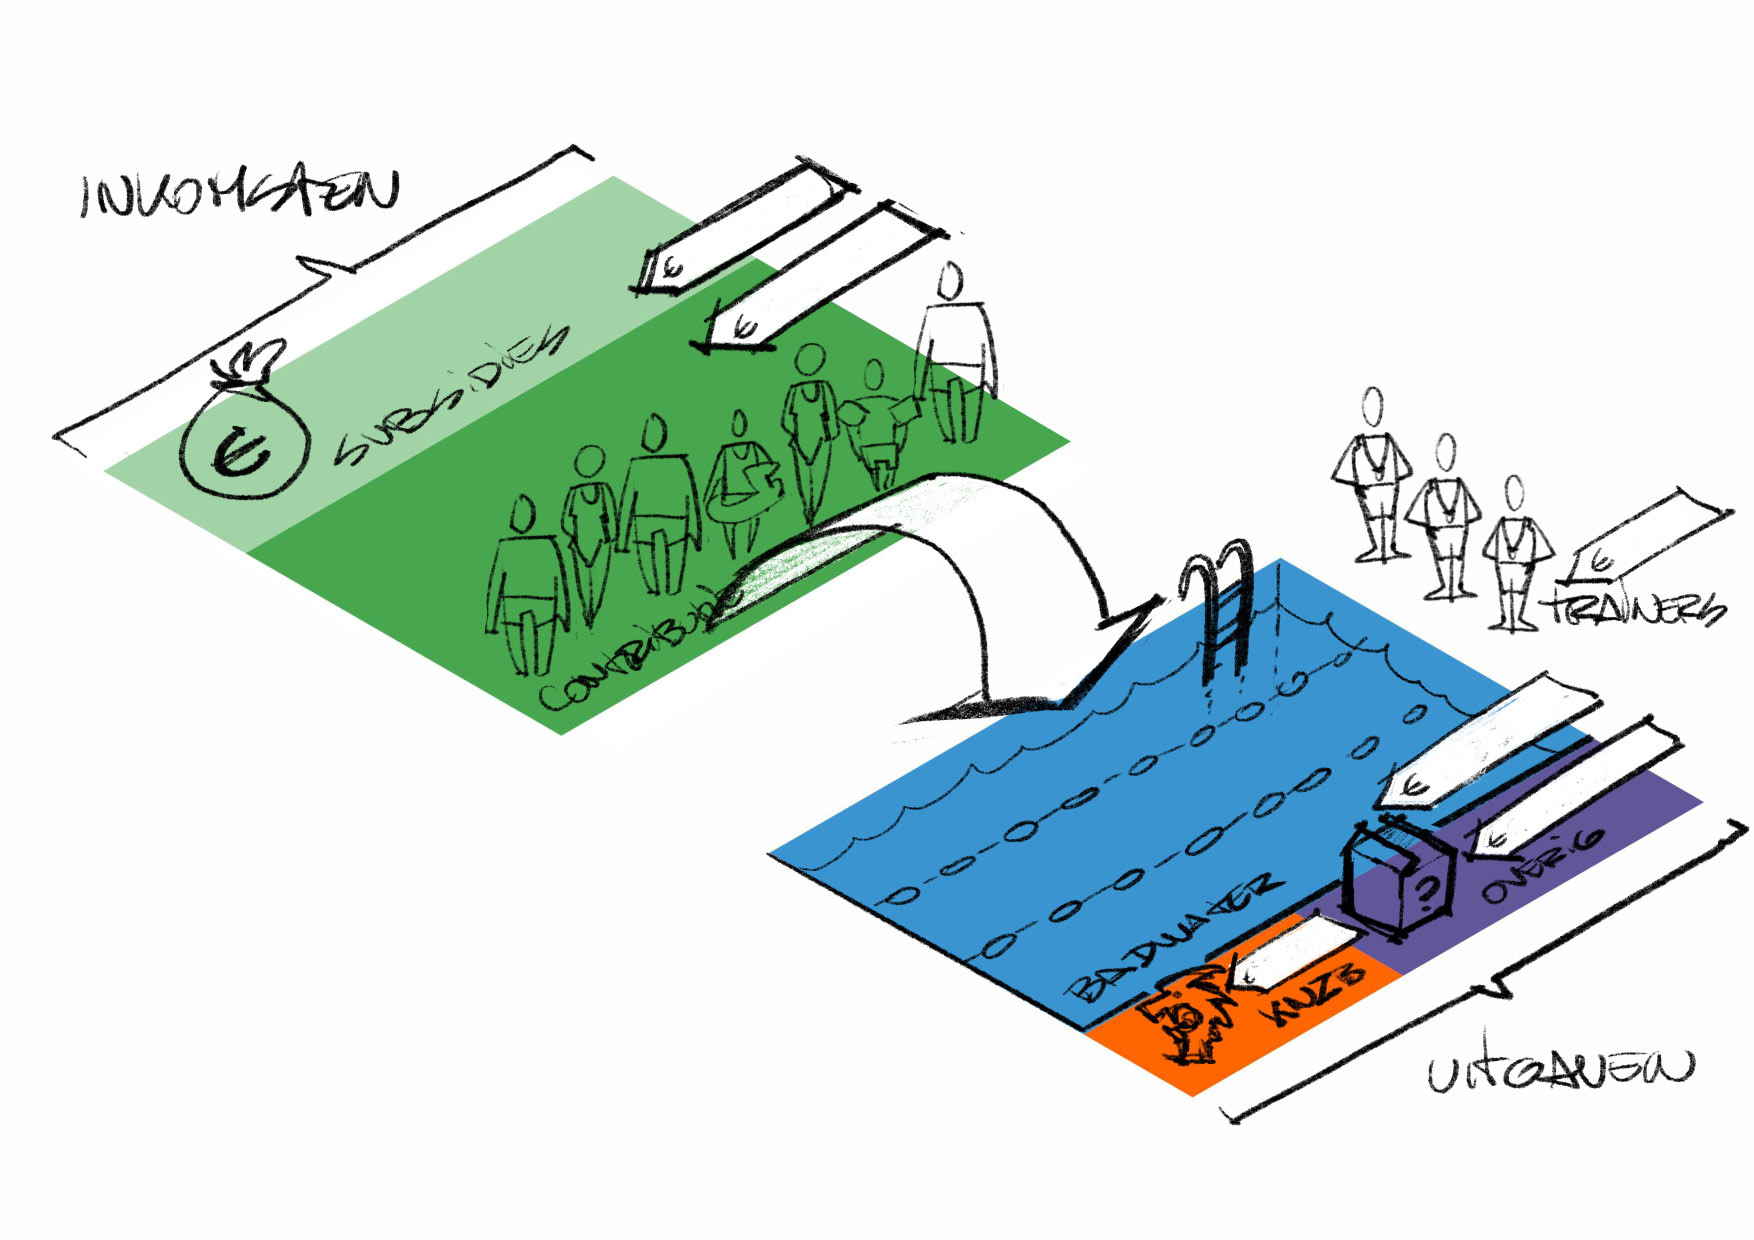
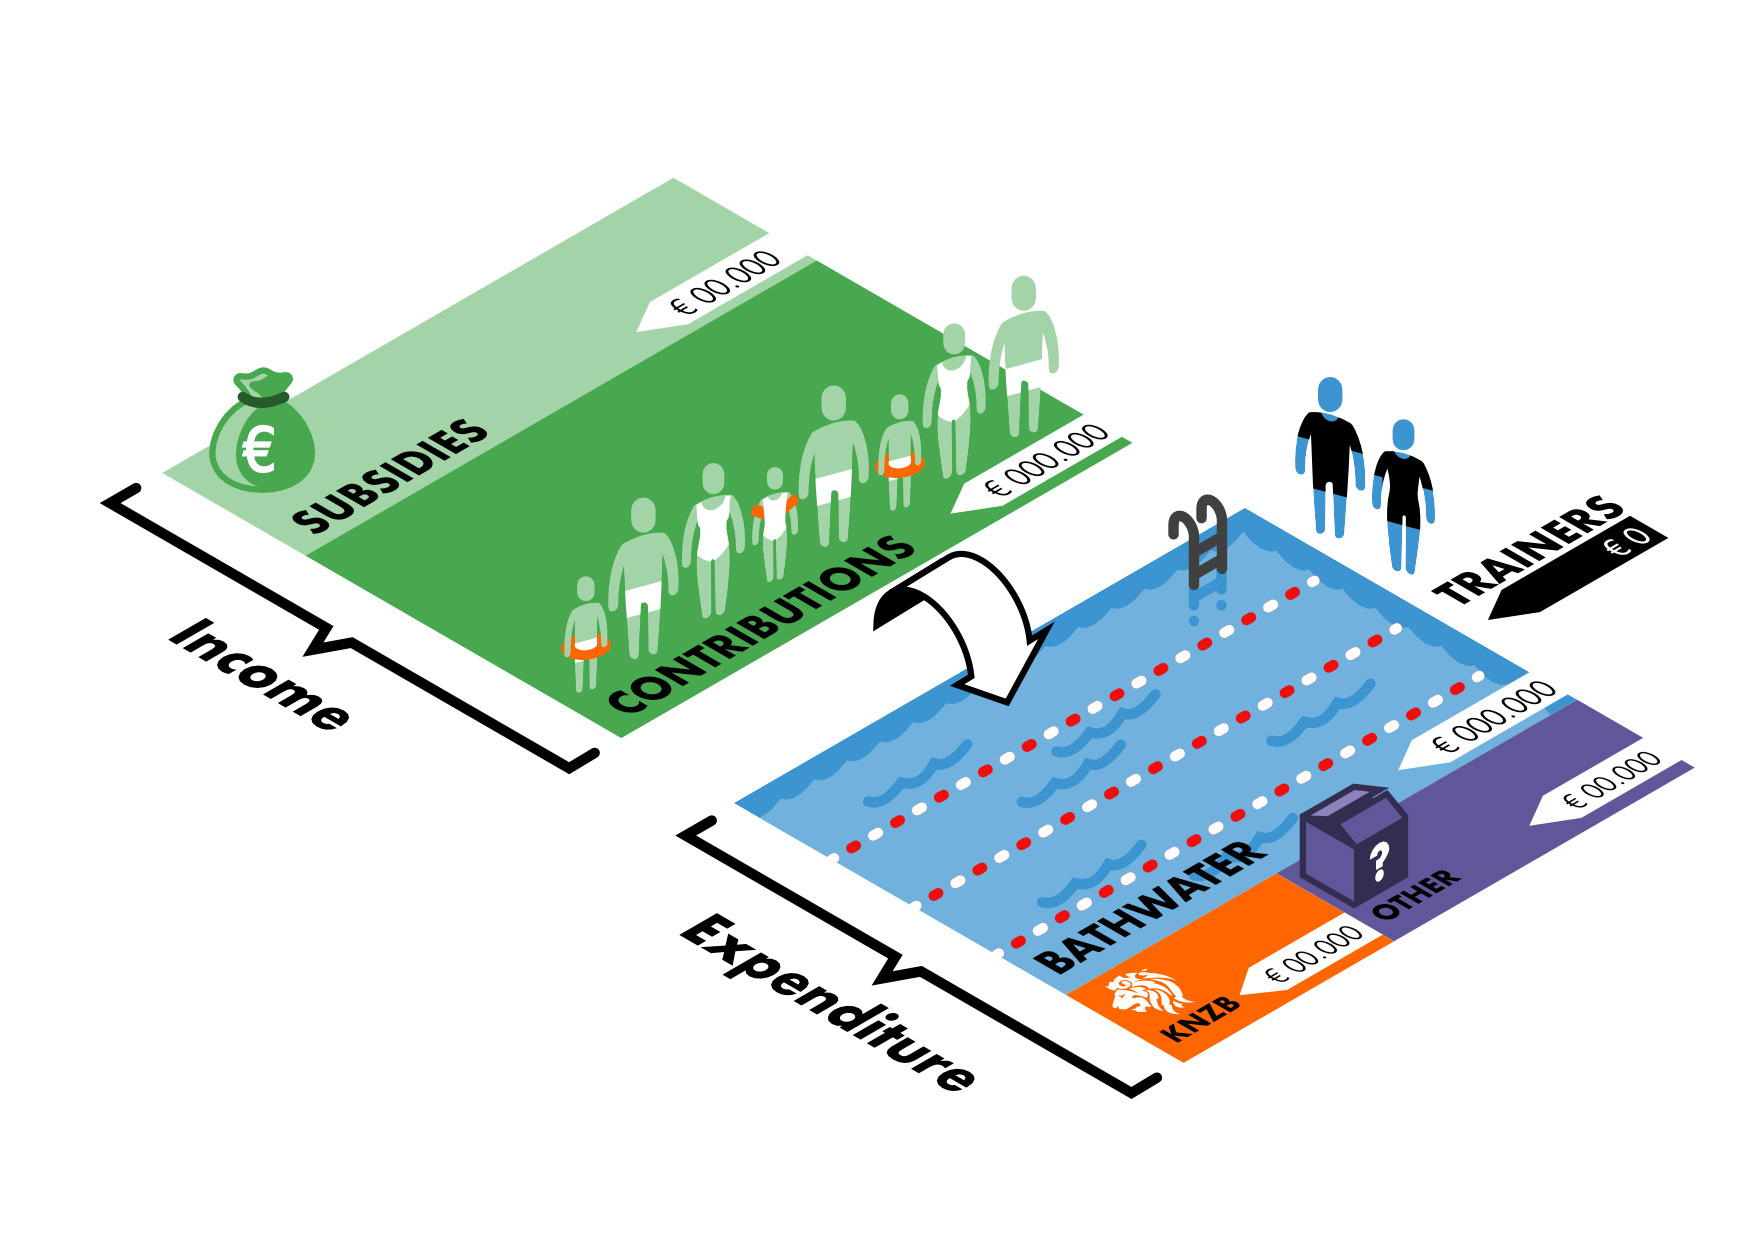
I was approached by a swimming club develop a visual explaining to their members just where their contributions ended up. There was a discrepancy where their members thought the funds where going (the trainers, who are in reality all volunteers and dedicate a significant part of their free time to the club without compensation) and where it actually ended up (majorly the bathwater and the heating thereof).
The solution was simple: show, don't tell with a proportional area chart, and of course I could not resist putting it all in isometric perspective, just so I could draw an actual pool in the chart.