Platform31 Data Visualization
information design, infographics
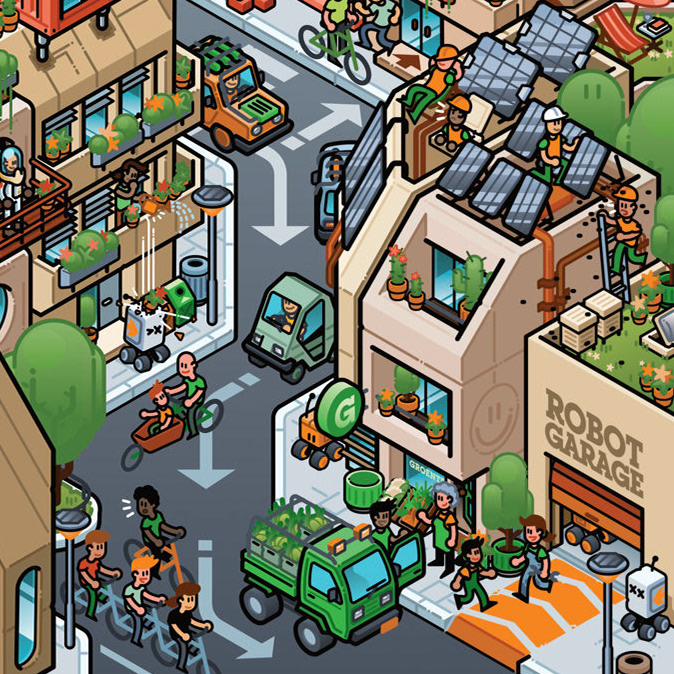
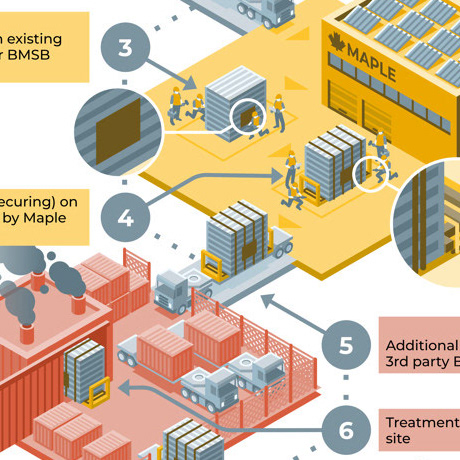
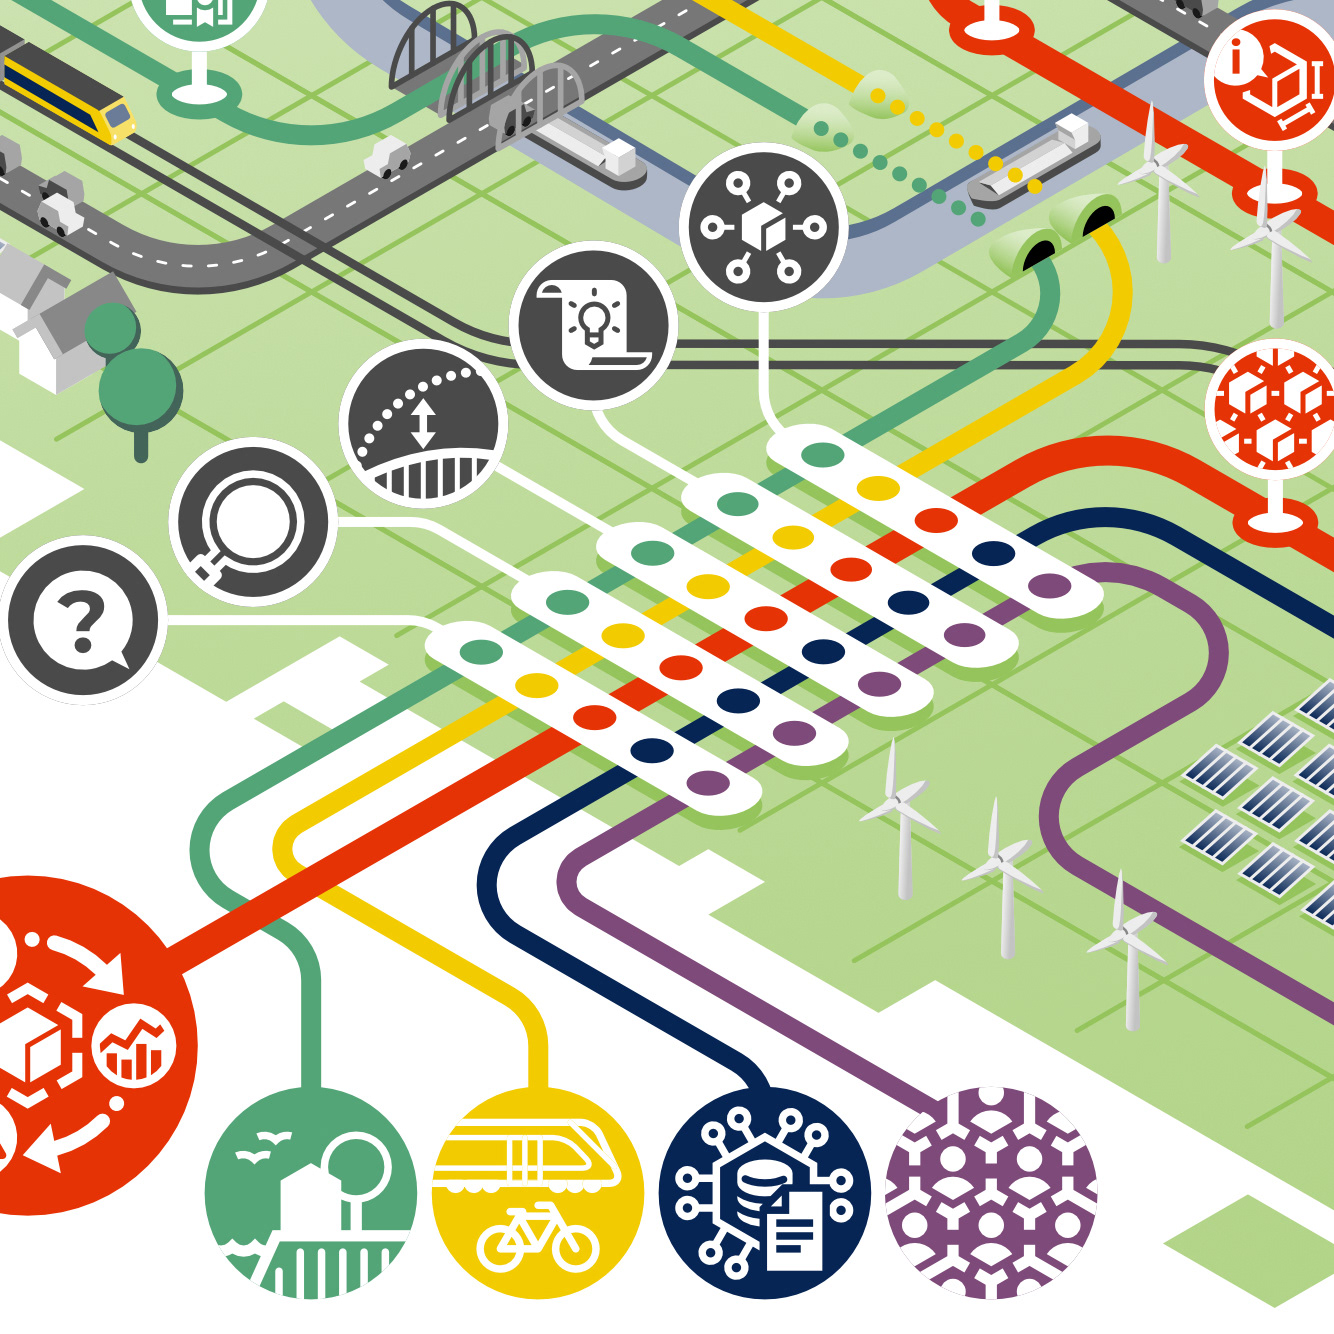
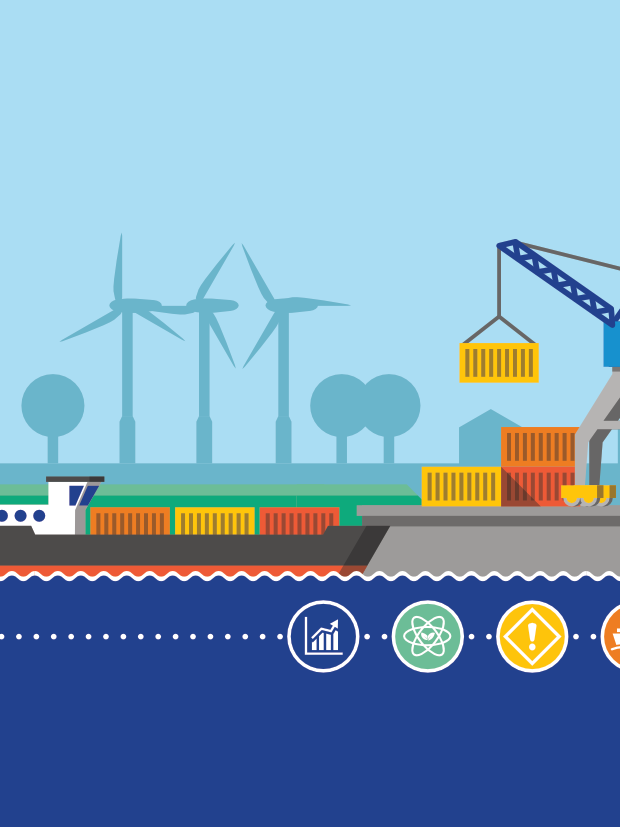
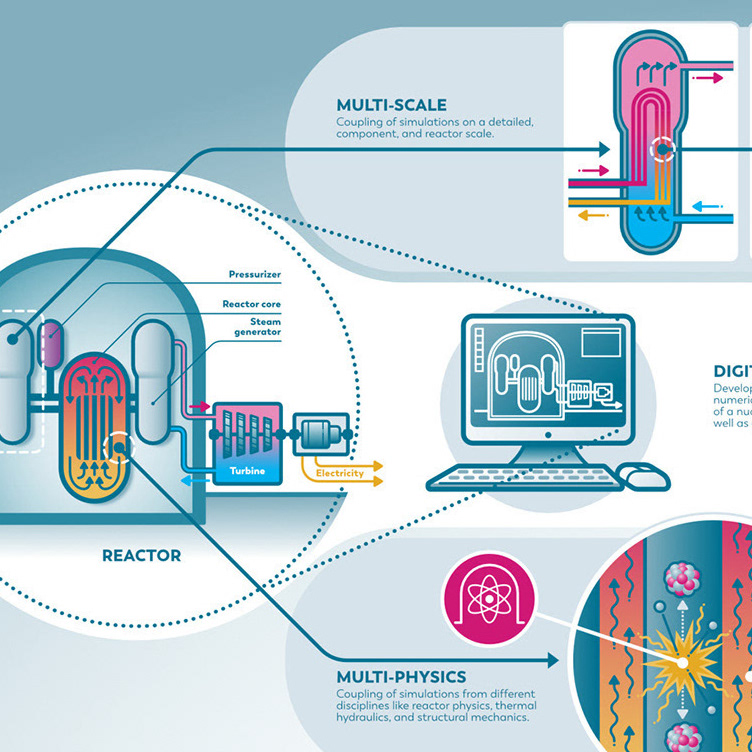
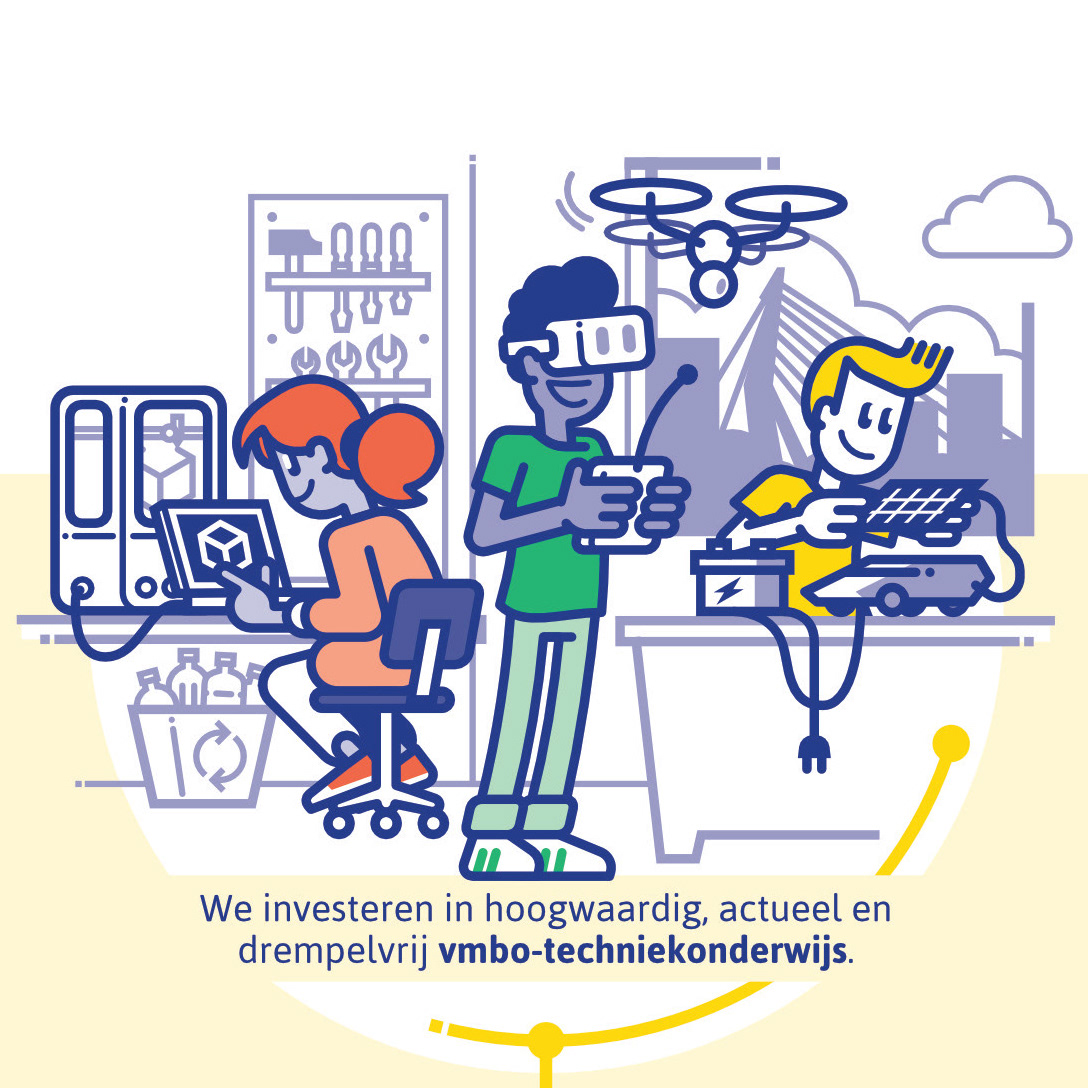
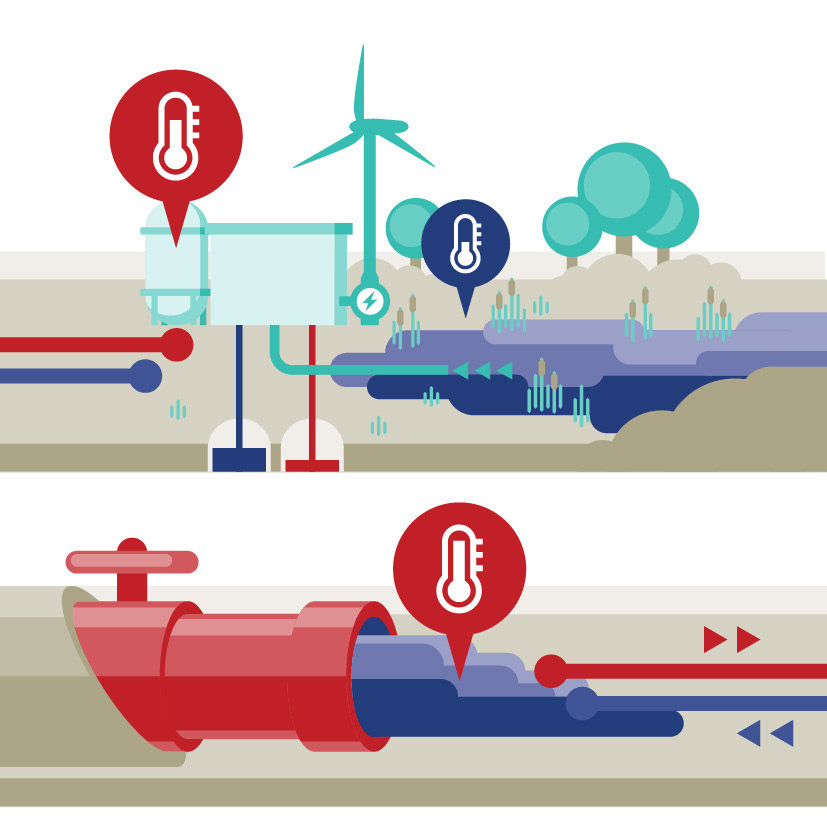
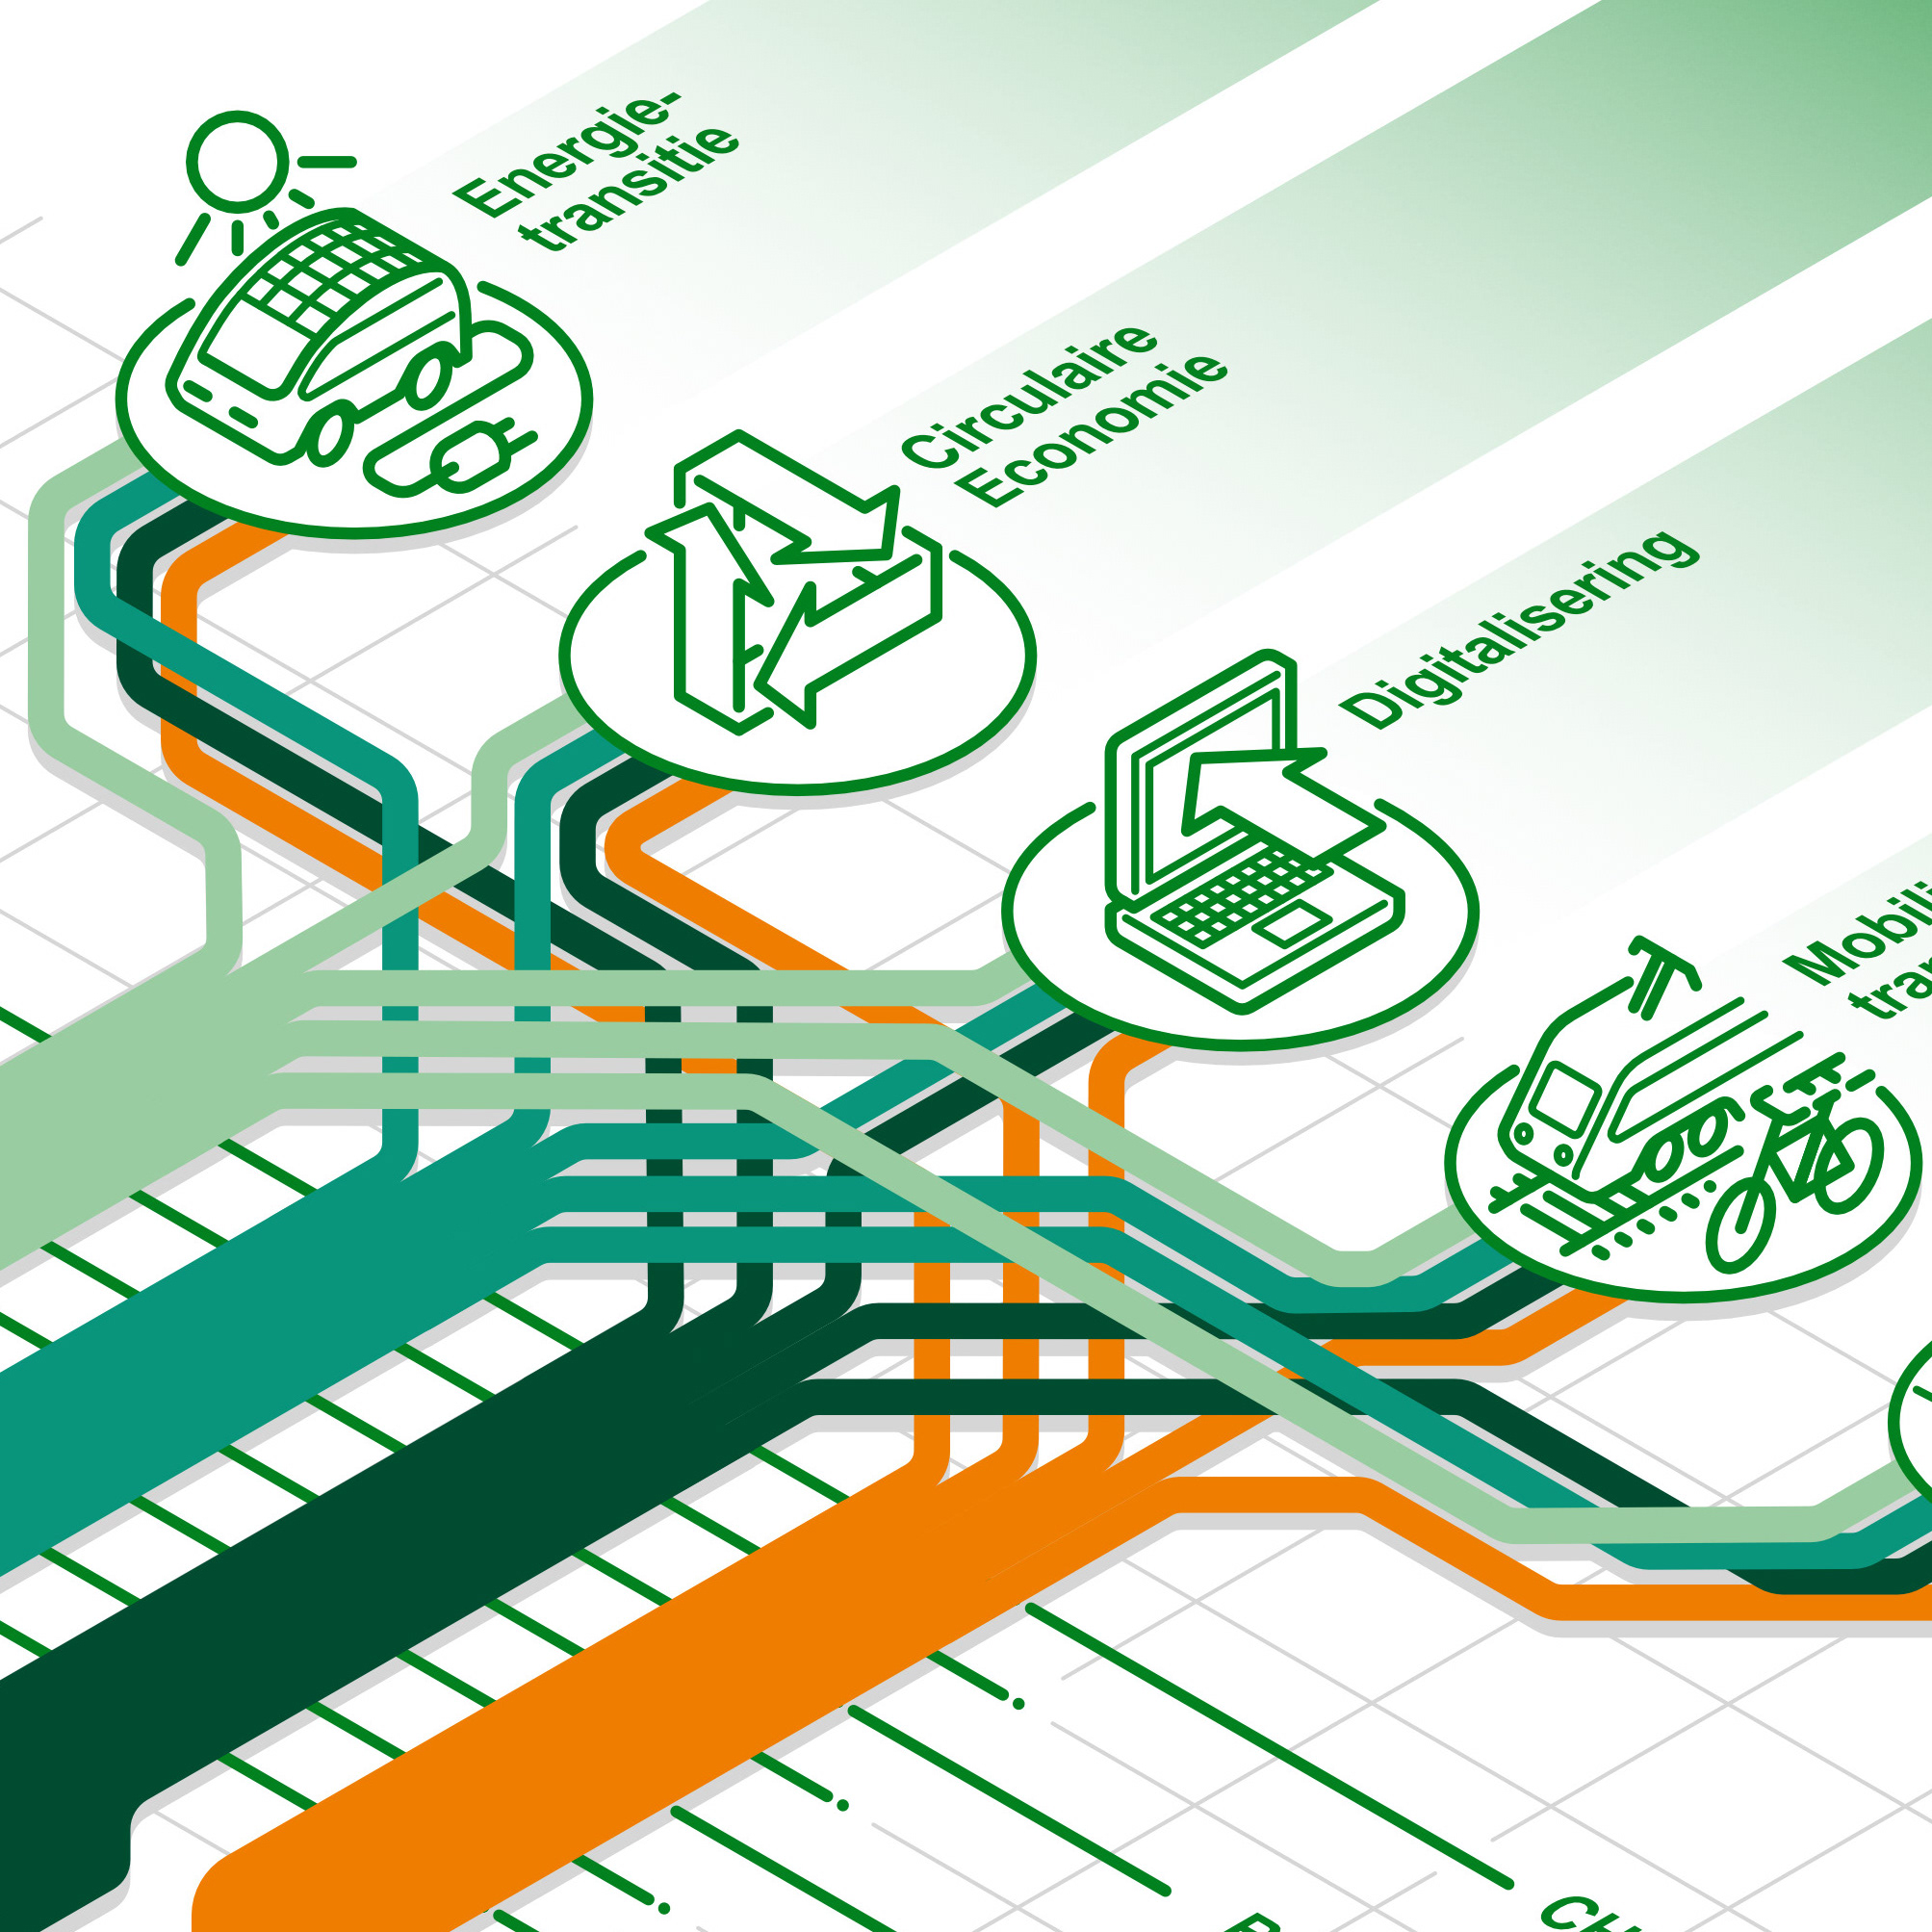
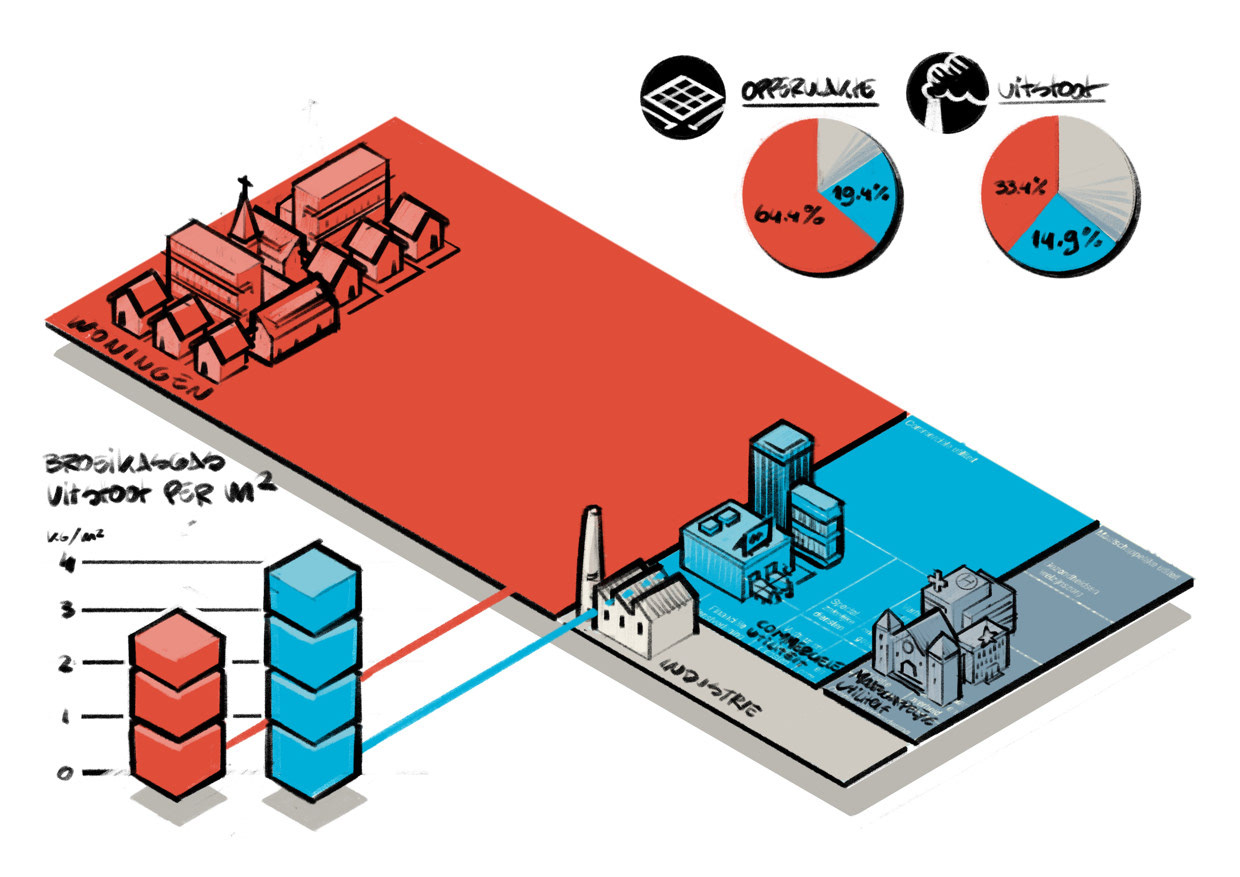
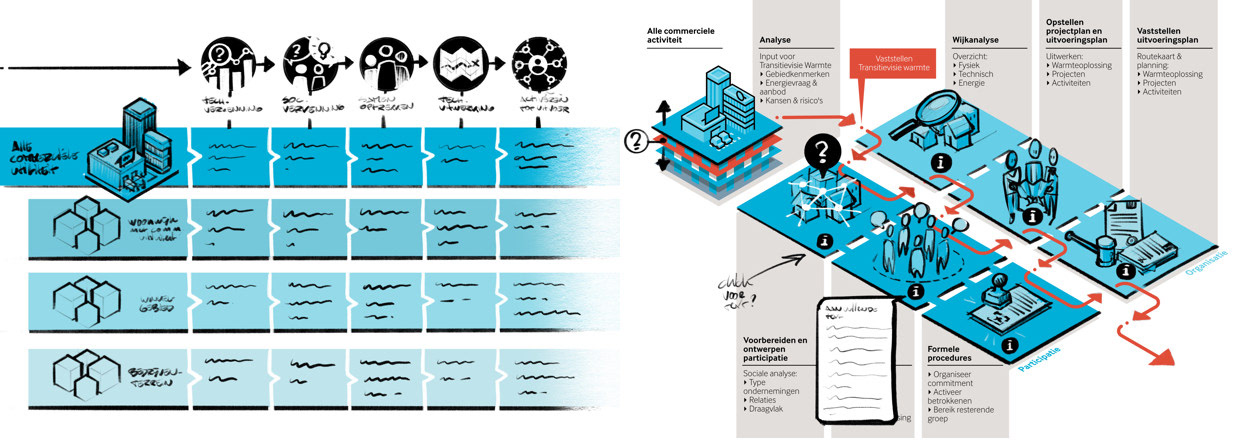
Design, layout and illustration of two infographics for Platform31, a knowledge and network organization for dutch cities and regions. Together with the client I developed a clear visualization of the data and and interactive roadmap for the various stakeholders, all in a style conforming to their already existing corporate identity while expanding their overall visual language with playful elements.
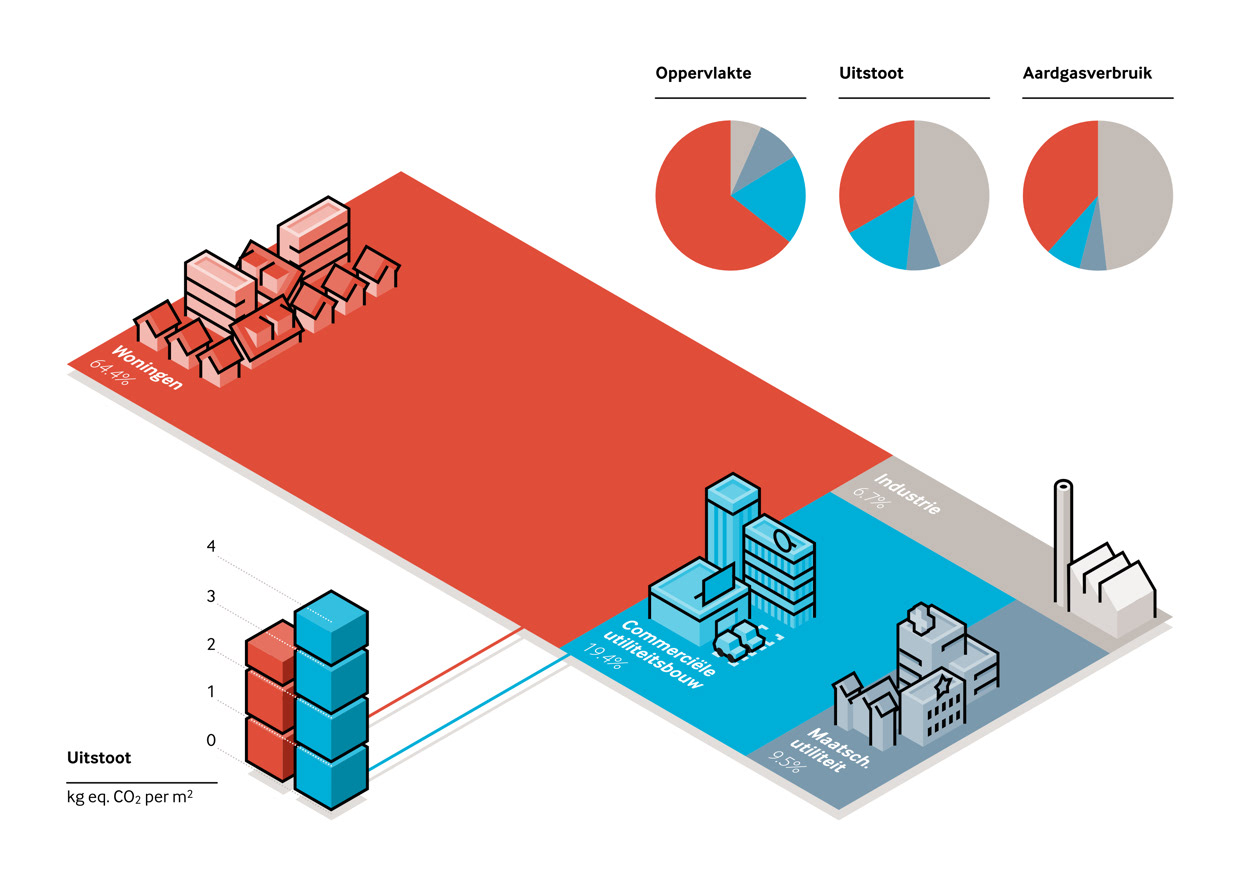
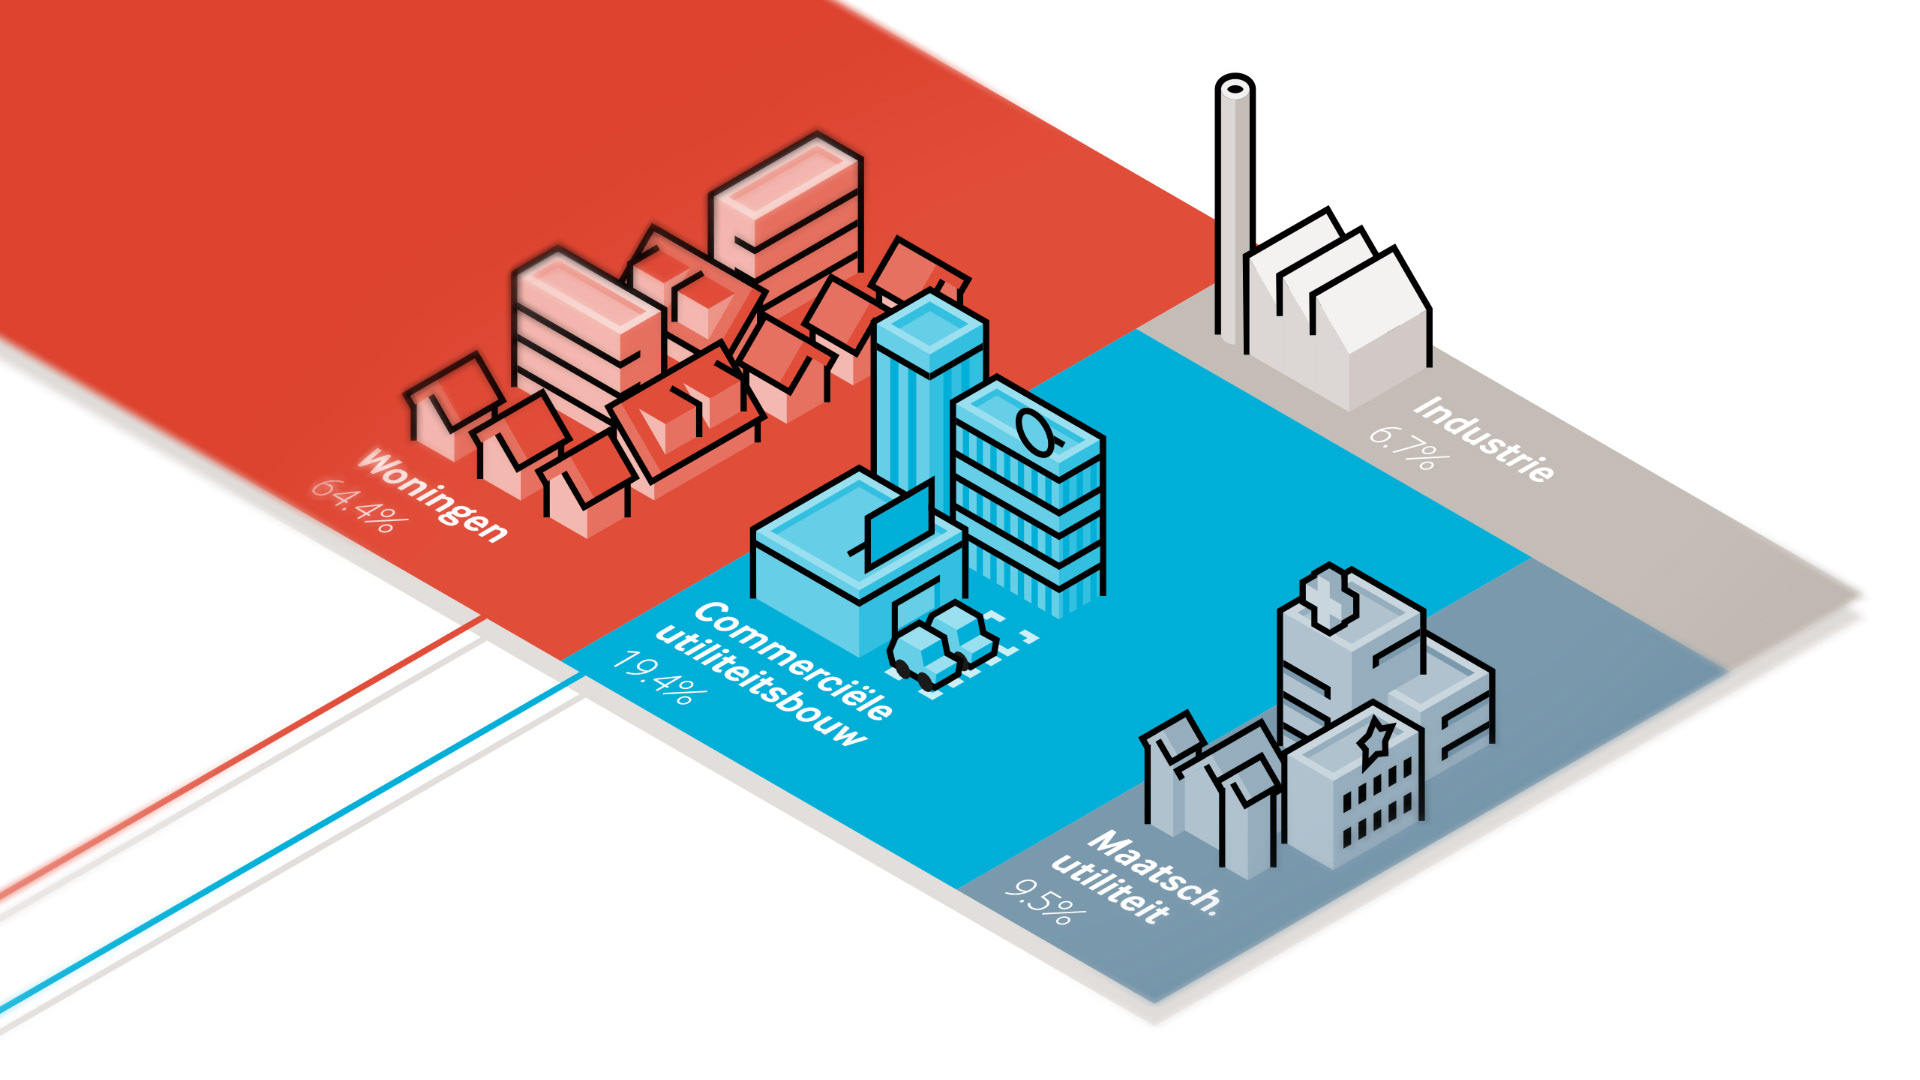
Finished data visualization infographic
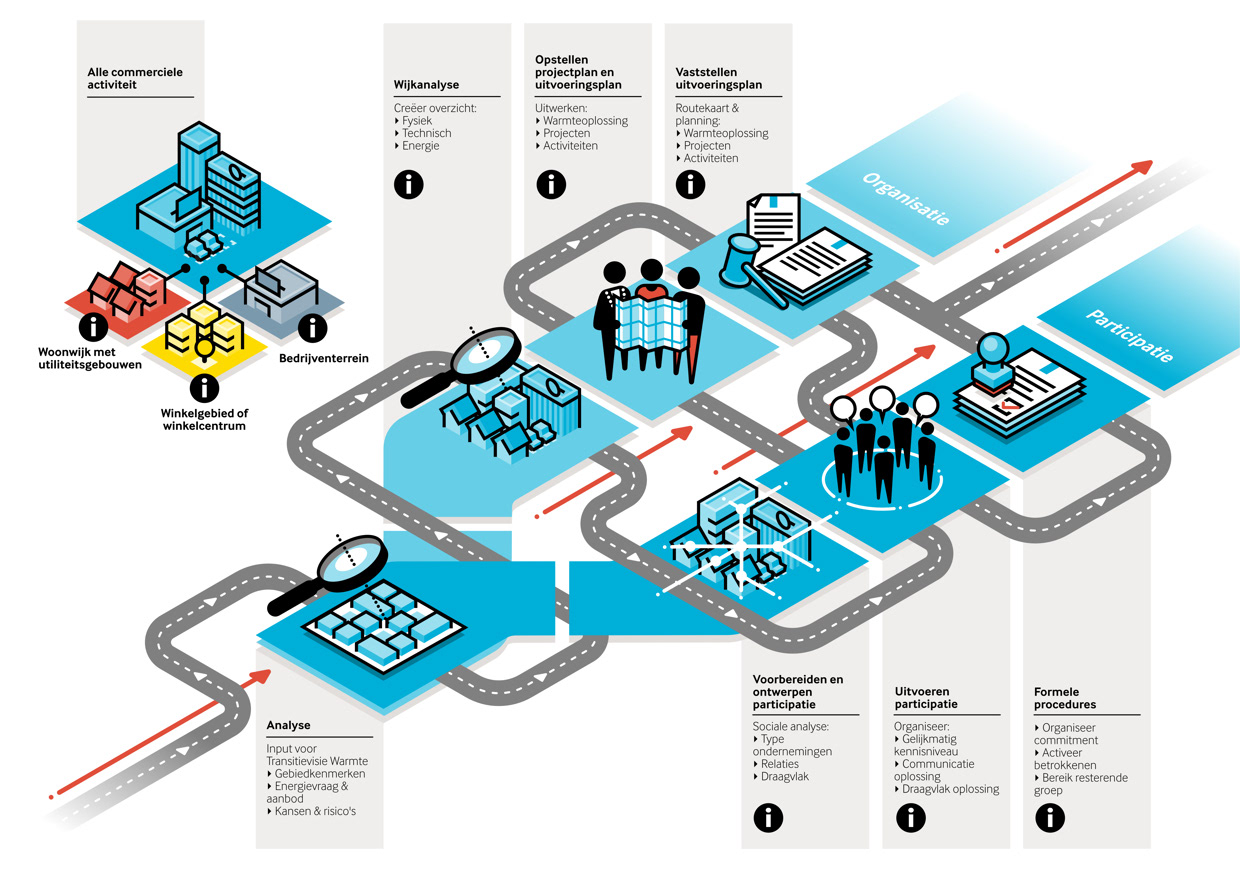
Finished roadmap infographic
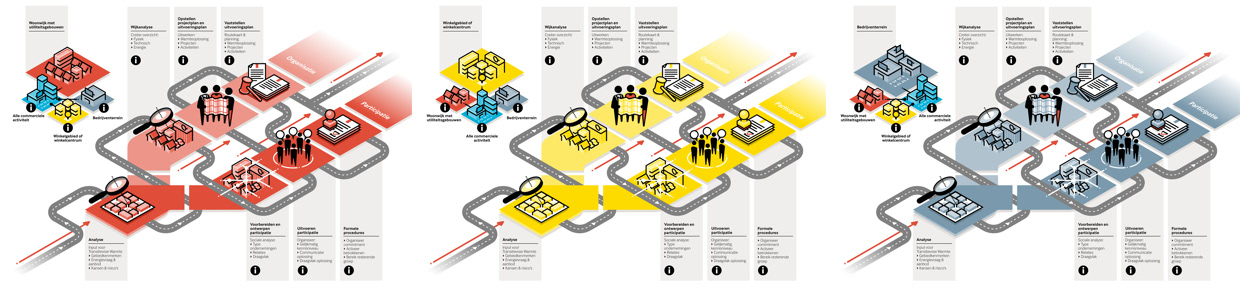
Colour variations
Mockup sketch
Sketches

Mockup sketch